| |
While the 31-50 age group is best represented at 33.7%
this is balanced by both teenagers at 9.9% and those over
65 at 14%. This pattern is compatible with the 1996
national census balance.
Family SizeIn
exploring family size it was found that the average
household size was 4 people. As can be seen from Table 2,
64.9% of those surveyed had this number or less while the
remaining 35.1% of households had more than 4 members.
Table
2: Family Size ( n=94, Mean=4.032)
Number
Household
|
Number
Respondents
|
Percentage
|
Cumulative
%
|
| 1 |
3 |
3.2 |
3.2 |
| 2 |
21 |
22.3 |
25.5 |
| 3 |
13 |
13.8 |
39.3 |
| 4 |
24 |
25.5 |
64.8 |
| 5 |
14 |
14.9 |
79.7 |
| 6 |
10 |
10.6 |
90.3 |
| 7 |
4 |
4.3 |
94.6 |
| 8 |
4 |
4.3 |
98.9 |
| 9 |
1 |
1.1 |
100.0 |
| Total |
94 |
100 |
100 |
|
Occupation
The questionnaire also provides
details of the occupations of those interviewed.
We break these into the six categories outlined
in Table 4. As can be seen 46.5% of those who
responded were employed outside the home, 12.9%
were in training or education and 37.7% were not
in paid employment being either retired,
unemployed or working in the home. The remaining
3% worked from their homes. This shows almost
exactly a 1 to 1 dependency ratio from those
surveyed.
Table
3 Occupation of Those Interviewed (n=101)
|
| Occupation |
Number |
Percentage |
| Unemployed or
Working Full Time in the Home |
25 |
24.8 |
| Employed in the
home |
3 |
3.0 |
| Employed outside
the home |
47 |
46.4 |
| Post Primary
School |
3 |
3.0 |
| Training or
Further Education |
10 |
9.9 |
| Retired |
13 |
12.9 |
| Total |
101 |
100.0 |
The personal data shows that the
sample chosen, when compared with statistics
compiled from the 1996 census, is typical of the
general population in Monasterevin. The average
person interviewed could be said to be aged
between 30 and 50, be employed outside the home,
have a family of four and is most likely to be a
lifelong resident in Monasterevin.
|
3.2 Current Transport Usage
This section focused on car ownership,
the numbers of both long and short journeys made
and the purpose of them.
3.2.1 Car Ownership
We noted that 62% of all respondents owned a car,
(excluding the under 19's this figure rose to
68%), with 10% of households surveyed having more
than one car. Factors influencing care ownership
included;
Occupation:
Those working outside the home being most likely
to have a car and students and the retired least
likely to have one.
Age:
Nobody under the age of 19 owned a car and 43% of
the over 65s did so.
Location:
Those living in the outlying townslands were more
likely to own cars than the families based more
centrally.
3.2.2 Short Journeys
When questioning people on their travel patterns
they were asked to outline the number of short
journeys that they made each week. In so doing,
they had to identify both the destination and the
purpose of their journey. This was to ensure that
the answers were carefully considered and
reliable. The destinations defined as
constituting short trips were as follows; Naas
(Sallins), Kildare, Newbridge, Portarlington,
Portlaoise, Athy and Carlow. It should be noted
that each of these towns has a rail link with
Monasterevin and is within 30 minutes journey
time. This link is not in operation with the
station being closed.
In compiling the results it was
found to be useful to use the number of journeys
per month and this is the figure outlined in
Table 4. As can be seen we have categorised the
commuters into five groups depending on the
frequency of travel. Almost half of the
respondents (47.5%) make less than 20 journeys
per month. The frequent travellers make the vast
majority of journeys. The 98 respondents reported
making 2252 short journeys each month, with the
average therefore being 23 journeys. It can also
be noted that the major potential users are those
in the medium to frequent traveller categories.
Table
4: Short Journeys Made Per Month (n=98)
|
Journeys per Month
|
No. of People
|
Percentage
|
No. of Journeys
|
| 0-10 |
27 |
27.3 |
151 |
| 11-20 |
20 |
20.2 |
319 |
| 21-30 |
26 |
26.3 |
595 |
| 31-40 |
13 |
13.1 |
447 |
| 41 or more |
13 |
13.1 |
590 |
| Total |
98 |
100.0 |
2252 |
|
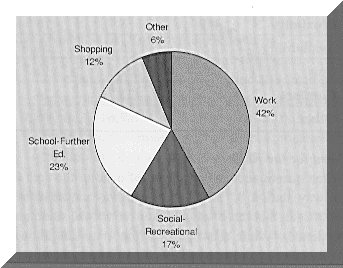
Purpose of the short journeysThe
opportunity was also taken in the questionnaire
to identify the purpose of the journeys made. The
categories given as options were as follows,
Work, Social-Recreational, School/Further Ed1,
Shopping or Other Reasons. The results are
summarised in Chart 1. The chart shows almost an
equal split between Work, Social-Recreational and
shopping ourneys with work related journeys being
in the majority.
|
Chart 1: Purpose Of Short Journeys (n=98)
|
3.2.3 Inter-city Journeys
A similar analysis for long journeys
i.e. to city destinations (Dublin, Cork, Galway,
Belfast or Limerick) is outlined in table 5.
19.8% of those interviewed travel two or more
times per week, with12.9% commuting on a daily
basis (This projects to 270 daily commuters for
the total population).
Table
5: Inter-city Journeys Made Per Month
(n=98)
|
City
Journeys |
Number |
Percentage |
Cumulative
of Journeys |
Number |
| Rarely
if ever |
15 |
14.9 |
14.9 |
0 |
| Once
a week or less |
66 |
65.4 |
80.2 |
118 |
| Twice
a week |
7 |
6.9 |
87.1 |
43 |
| Daily |
13 |
12.9 |
100 |
265 |
| Total |
101 |
100.0 |
100.0 |
426 |
1. We believe
that this figure is low, as many 3rd
level students may have been working away from
home during the summer.
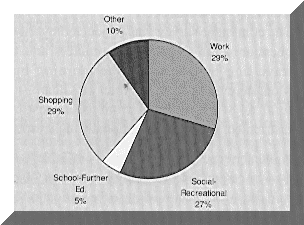
Purpose of
Inter-city Journeys
Chart 2 outlines the purpose of
these journeys. It contrasts with the previous
chart in that by far the largest proportion of
journeys are made for work and school or further
education while shopping and social-recreational
trips are less significant.
Chart 2: Purpose of
Long Journeys (n=98)
|
|
3.2.4 The Possible Impact of a Railway Station
In order to assess the possible impact of
reopening the railway station in Monasterevin we
looked at people's preferred mode of transport,
their reasons for this preference and the number
of journeys they would change from their current
method of travel to rail if that option were
available. We also asked people to indicate their
perceived need for a station and their level of
commitment to the campaign for its re-opening.
Preferred Mode of
Transport
As can be seen from table 6
people’s choice of transport depends on
whether they are making an inter-city journey or
a shorter journey. While the train is popular in
both instances it is by far the preferred mode of
transport for city journeys with 82% of
respondents selecting it as their first
preference.
Table
6: First Preferred Mode Of Transport
|
| Mode |
Preference for short
Journeys (%) |
Preference for
Inner-city Journeys (%) |
| Car |
58.0 |
15.0 |
| Minibus |
1.0 |
0 |
| Private
Coach |
0 |
3.0 |
| CIE
Coach |
2.0 |
0 |
| Train |
39.0 |
82.0 |
| Other |
0 |
0 |
|
When asked to identify the factors
affecting their decision, comfort was the most frequently
mentioned followed by availability-timing and cost. These
factors are illustrated in Table 7.
Table
7: Factors Influencing Respondents Choice of
Transport
| |
1st Factor
influencing Choice(%) |
2nd Factor
influencing Choice(%) |
3rd Factor
influencing Choice(%) |
| Proximity |
8.9 |
8.7 |
16.5 |
| Availability |
13.9 |
15.2 |
21.5 |
| Cost |
12.9 |
22.8 |
12.7 |
| Comfort |
41.6 |
21.7 |
24.1 |
| Other |
5.0 |
7.6 |
6.3 |
|
Need for the Railway Station
When questioned as to the level
of need in the area for a railway station 8.9%
felt the need was moderate while 91.1% felt that
there was a great need for the station to be
re-opened. While this figure is important and
shows an overwhelming desire by the people of
Monasterevin to see their station re-opened, a
more important statistic was that 79.2% of people
interviewed gave their names and addresses and
expressed a desire to become involved in the
campaign.
Potential
Use Of The Railway Station
This section will outline, perhaps, the most
striking findings in the research. They
relate to people's potential use of a station in
Monasterevin. Part of the survey asked the
respondents to examine which of their short and
long journeys they would change to rail if that
option was available.
Short-Haul
Journeys
Of the short distance journeys, the groups with
the highest potential usage of the station were
those working and studying, 65% of whom said they
would change to the rail option. This would
comprise a total of 505 monthly rail journeys.
While the shopping and recreational users also
expressed a significant willingness to use rail
it is less likely that they would fully exploit
the option, we, therefore, disregarded short-haul
social and shopping users for the purpose of this
study.
Inter-City Journeys
When questioned about their ability to use the
potential facility inter-city travellers were
very enthusiastic with a 92% uptake rate. This
amounts to 390 journeys per month, 244 (or 63%)
of these being daily commuters.
Total Potential Users
Adding the potential inter-city
commuters and the short-haul work and education
related trips the total number of users for the
service, from the respondent group, will be 895
per month. This amounts to 30 potential
passengers per day. Accepting a 50% rate of error
on transfer to a rail option, this gives a
conservative figure of 15 passengers per day from
a population of 101. Relating this to the whole
of the resident population in the town of
Monasterevin the potential number of daily users
for the station is 315.
In Summary
This section documents some general
information on the people surveyed and it
demonstrates that they are a typical
cross-section of the population of Monasterevin.
We looked at current travel patterns and found
there to be over 2000 short journeys and over 400
inter-city trips made by the 101 people
interviewed each month. On exploring these
journeys in detail we found that at least 10% of
them would be made by rail if that option were
available. When extrapolated to the total
population this amounted to 315 passengers using
the station on a daily basis.
|
3.2 COMMUNTER SURVEY
The commuter survey was conducted by
distributing questionnaires to known commuters
and to those travelling to Dublin by the morning
bus from Monasterevin or from the train at
Kildare station. In total 64 were returned from
100 questionnaires distributed, giving an
exceptionally high response rate.
As can be seen from the summary in Table 8, 42 of
the 64 who responded were daily commuters, 40 of
whom said they would definitely use the station
in Monasterevin. The remainder used the train
less frequently but were all positive about using
the train if the service became available.
Table
8: Summary Information from Commuter
Survey
|
Frequency
Travel |
Number
Commuters |
Definitely
Station |
Possibly
Station |
Would
Not Use Station |
| Daily |
42 |
40 |
2 |
0 |
| Twice Weekly |
9 |
9 |
0 |
0 |
| Once weekly |
12 |
12 |
0 |
0 |
| Other |
1 |
1 |
0 |
0 |
| Total |
64 |
62 |
2 |
0 |
This information shows an
overwhelming desire on the part of morning
commuters leaving Monasterevin to use the train.
It demonstrates that there is a definite core
user base for the service, both transferring from
other modes of transport or freeing-up the
parking facilities at Kildare Town.
|
3.3 BUSINESS SURVEY
The information collected in the
business survey is detailed and focuses on the
possible use of the station by employees,
customers and as a means of transporting
materials. It also documents the
‘knock-on’ employment that the station
would create in the town and the other economic
impacts it could generate.
3.3.1 Potential Use of
the Station by Employees
The 24 businesses interviewed were
mostly long established employers giving work to
a total of 684 people in the town. Of these 151
traveled from outside the Monasterevin area and
112 could use the train as a means of getting to
work. Indeed one employer, Moore Abbey, outlined
how the train would prove invaluable to both
staff and clients. 20 Trainee Nurses presently
travel by private bus to Trinity College / St.
James Hospital. As many of the centre's clients
are disabled and currently travel from outside
Monasterevin the train would greatly improve
their quality of life. There are therefore 112
potential daily train users who would be
travelling into Monasterevin on a daily basis.
3.3.2 Potential Use of
the Station by Customers
Most of the businesses interviewed
believed that clients would use the station and
broaden their customer base. 19 said that it
definitely would, 4 said possible and 1
respondent said that all of their custom was
local. This shows a general consensus that the
station would be good for business. This is
indeed extended to the positive impact that it
could have on the overall economic climate in the
town with most respondents feeling that it would
have very beneficial effects.
3.3.3 Use of the Station for
Transporting Material
Of the 24 interviewed 9 businesses said that they
would use a railway freight service if it were
available. Of these 9 potential freight
customers, 5 transport material in bulk on a
regular basis in and out of Monasterevin.
3.3.4 ‘Knock-On’
Employment Potential
In total 16 of the 24 businesses interviewed
anticipate that they would expand the number of
their employees as a result of the station
reopening. While 7 found it difficult to quantify
such an expansion, the remaining 9 businesses
projected the creation of 16 new jobs in the
area.
 |
The Goods Yard and
Cattle Pems 1999!!
|
In
Summary
The business survey was informative
in that it identified 112 potential daily
commuters from among staff of the 24 businesses
who responded. This is a figure separate from the
statistics quoted in the random survey in that
the respondents in that case were local
residents, while the figure of 112 is drawn from
people travelling from outside to work in
Monasterevin. Furthermore,, there are several of
those surveyed who anticipate that their clients
would also use the train. While there was
general agreement that the reopening of the
station would create a positive economic
environment for the town, the creation of 16 new
jobs was projected as a result of the move.
|
|